ISO 20022 — Visualization
ISO 20022 — Visualization
October 24, 2024
Abstract
This article presents an innovative visualization tool for ISO 20022 data, allowing users to easily explore complex financial information. By offering views on geolocated entities, detailed message structures, and cross-message connections, the tool enhances data exploration and supports more informed decision-making for operations, compliance, treasury and customer insights. Also, it will empower financial institutions to fully utilize ISO 20022’s potential in an AI-driven future.
Demo
The below video illustrates how Swiftagent visualization can be leveraged to unveil a potentially suspicious transaction in a cross-border payment scheme.
Context
The global effort towards ISO 20022 adoption is well underway. While the benefits of structured, richer data and enhanced interoperability are widely acknowledged, there is limited attention on real-world implementations and practical use cases that demonstrate how users and systems interact with this data. Few initiatives have truly allowed ISO 20022 data to “speak”, highlighting the shortcut it represents for data consumers, in particular on the business side.
At the same time, Artificial Intelligence (AI) is a top priority for financial organizations. Beyond the current hype, AI is here to stay, and as we’ve discussed [1], ISO 20022 can act as a key enabler for AI and business intelligence (BI) initiatives. With its standardized ontology, ISO 20022 provides a foundation for knowledge graph representations, which can help anchor applications built on large language models (LLMs) [2] and facilitate the interconnection of various business divisions or networks.
Motivation
We are unveiling Swiftagent visualization, the first visualization tool tailored specifically to ISO 20022. This tool offers a new level of insight by allowing users to engage directly with the data, revealing its full complexity and potential. By making the data more accessible and navigable, it supports deeper analysis and more informed decision-making. Our aim is also to promote data literacy across teams, empowering users at all levels to explore, understand, and utilize financial data more effectively.
Principles
We adhere to key principles that guide all our developments.
- Native ISO 20022: We stay as true to the standard as possible, ensuring the integrity and richness of the data remain intact.
- Holistic: The tool presents all available data, with no assumptions or filters, offering a complete view of the information without bias toward specific schemas or structures.
- Multi-usage, multi-user: A central golden view is provided to serve multiple stakeholders — whether for operations, compliance, compliance, treasury or customer insights — enabling versatile use across different functions.
View 1 — Geolocated entities
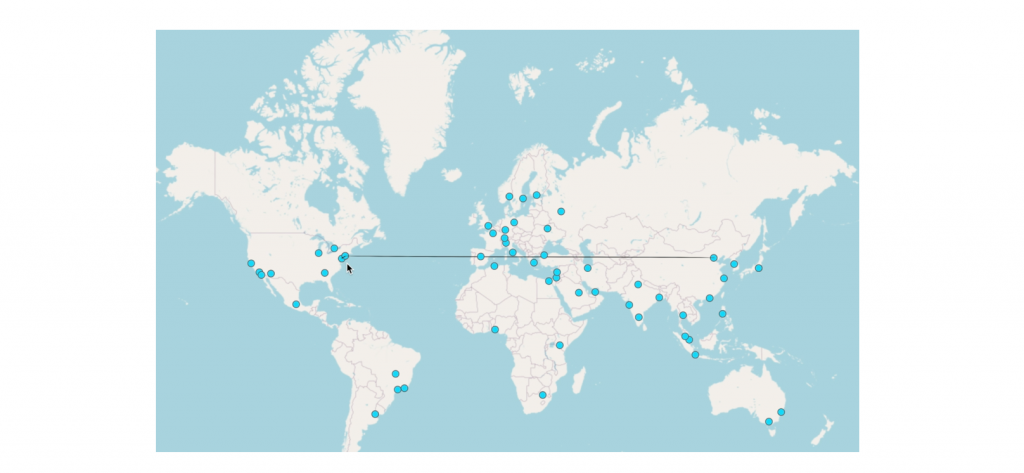
It’s challenging to grasp the “big picture” when focusing on granular operational details. Locations play a key role, not just for human understanding, but also in identifying transaction participants and their attributes, which can help distinguish between regular and suspicious transactions. Text-based postal addresses often lack the necessary context when viewed in isolation. Mapping these addresses provides a clearer picture of transaction flows, offering insights into who is transacting with whom, and under which geographical conditions, from cross-border transactions down to household-level clusters.

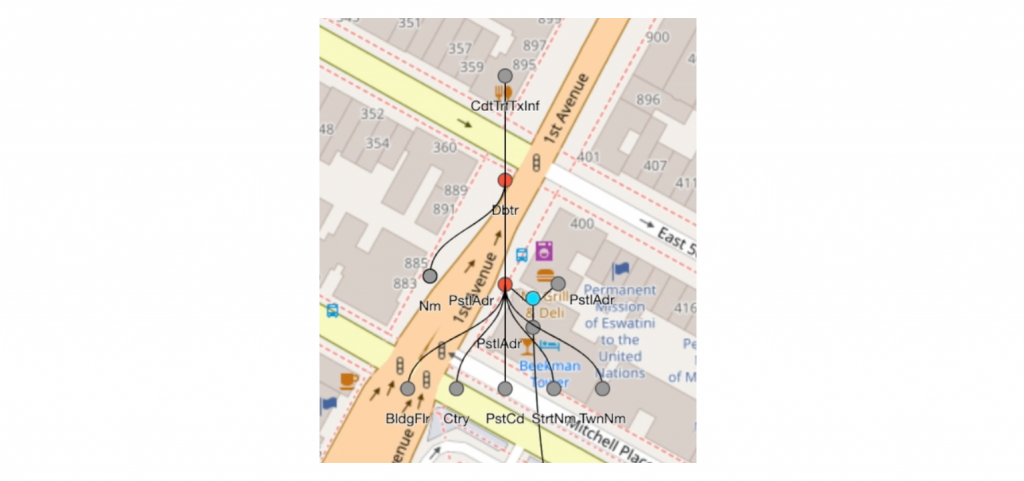
We address this by processing ISO 20022 messages through Swiftflow, attaching geo-coordinates to any postal addresses found within the messages. These geo-located entities are then plotted on a world map (see dots in Figure 1). Additionally, point-to-point cash flow movements are shown using the available (ultimate) creditor and (ultimate) debtor information (see line in Figure 1), providing a more comprehensive view of transaction flows and enhancing the ability to detect irregular patterns. Finally, our system links various messages to each location (Figure 2), even when entity names differ, allowing users to visualize and trace the full spectrum of transactions occurring at a specific location.

and related ISO 20022 messages (grey dots)
View 2 — Intra-message tree view
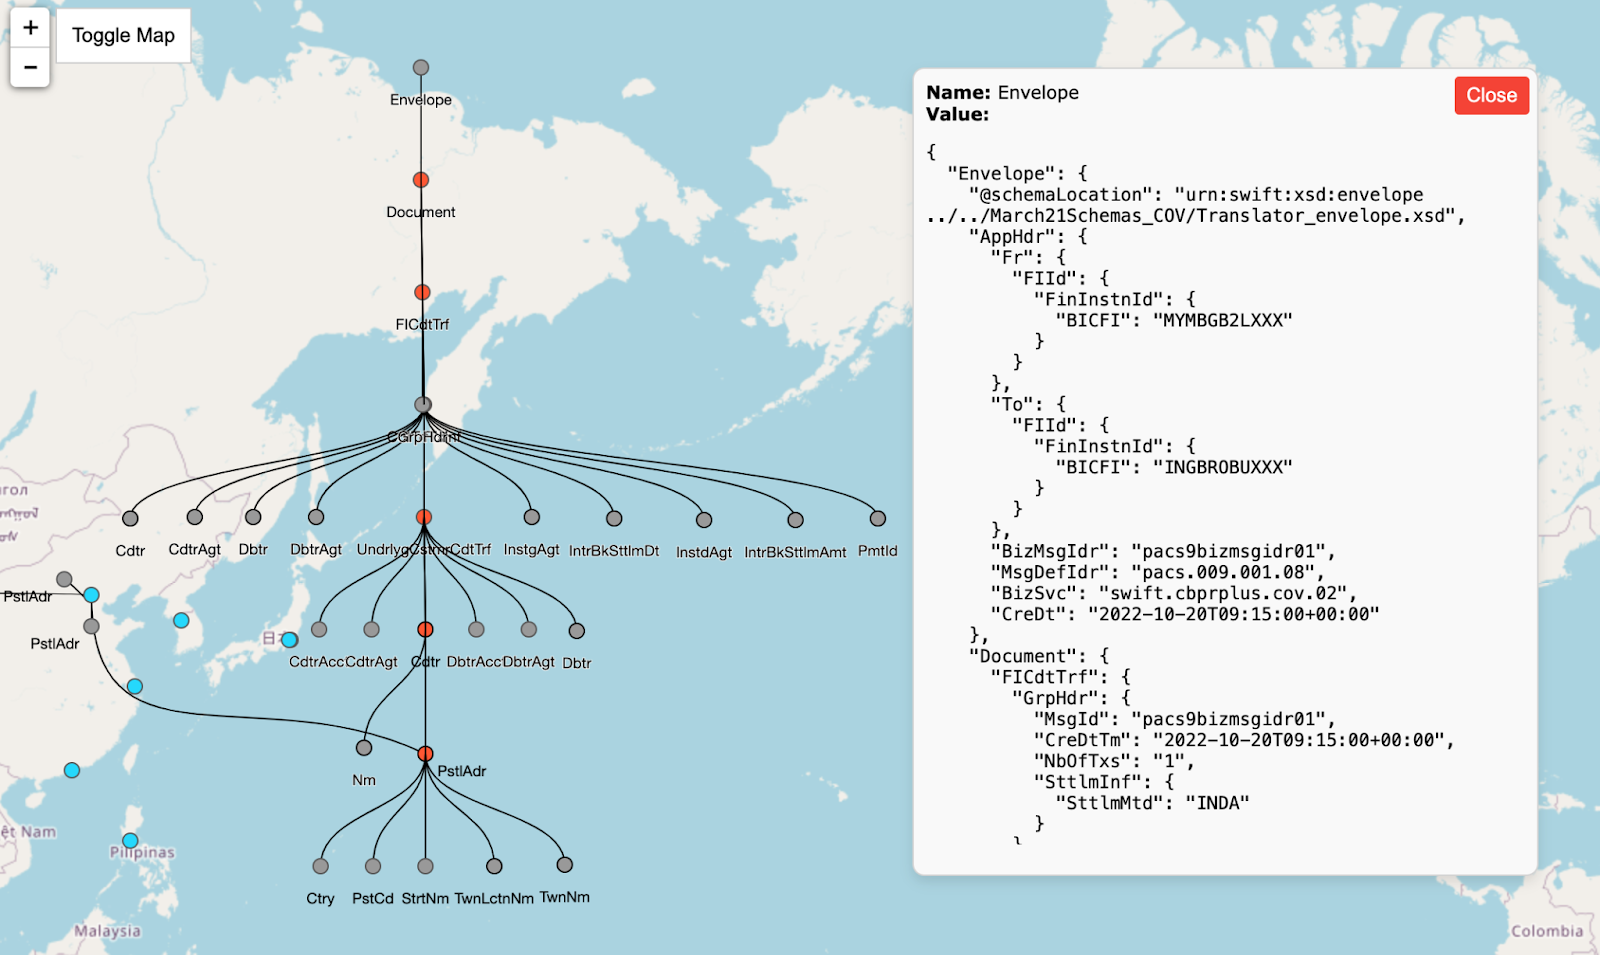
ISO 20022 is often described as “rich” and “structured,” but what does that mean in practical terms ? It means that the message format contains a vast number of fields [3,4], each organized into a tree-like structure with multiple levels, each level holding specific business relevance. The complexity of this structure makes it difficult for standard tabular tools to effectively capture and present the information, like the spreadsheets built on legacy data warehouses for example. Moreover, without examining the data directly, it’s impossible to fully understand how these fields are used in practice. Relying solely on typical fields of interest will miss important details. Additionally, as the standard evolves, new attributes and message types will continue to emerge, making it essential for ISO 20022 to be approachable not just for standards experts but for all users and use cases including operations, compliance, or customer insights.

Our tool allows users to explore ISO 20022 messages through a dynamic tree-like visualization. This approach enables users to reveal attributes of interest by unfolding data “on-click,” both upwards and downwards, based on their specific needs. Additionally, mouse-over functionality instantly displays field values, providing a seamless way to navigate and understand the message structure in real-time.
View 3 — Inter-message connections
While grouping transactions by identifiers like IBAN or UETR is straightforward, navigating through messages that contain a wide range of heterogeneous fields without knowing the exact location of the data points presents a significant challenge. Aggregating and exploring this data while maintaining clarity and coherence is nearly impossible with traditional tabular views, which lack the flexibility and depth required for meaningful analysis.

Our tool addresses this by providing a granular graph-based representation at the field level, ensuring that the full context of every transaction is preserved. Fields that share common values are visually connected, allowing users to seamlessly navigate through complex data relationships also including different message types (Figure 4). This approach enables deep exploration while maintaining clarity, giving users an intuitive way to engage with and understand the data across messages.
Conclusion
Swiftagent visualization for ISO 20022 bridges the gap between data complexity and user accessibility. By transforming how financial institutions interact with their data, it enables deeper insights, more informed decision-making, and enhanced operational efficiency. From mapping transaction flows to the planet earth map, to uncovering granular details within and across messages, the tool empowers users across various departments and use cases — operations, compliance, treasury and customer insights — offering a versatile solution that brings the full potential of ISO 20022 to life. As AI continues to advance, tools like this will play a vital role in ensuring human-AI investigations in tandem and explanability of AI agents.
Next step
Reach out directly to info@alpina-analytics.com to discuss your use case or visit Alpina Analytics for more information. We’ve confronted these challenges for years in real-life, high-risk application contexts, and we understand that banks need long-lasting proven expertise to mitigate risks, rather than quick wins that never make it to production.
About Us
Pierre Oberholzer is the founder of Alpina Analytics, a Switzerland-based data team dedicated to building the tools necessary to make inter-banking data, including Swift MT and ISO 20022, ready for advanced analytics.
George Serbanut is a Senior Technical Consultant at Alpina Analytics supporting Swiftagent — a conversational interface to navigate and query Swift MT and ISO 20022 data.
References
[1] https://medium.com/@pierre.oberholzer/iso-20022-an-enabler-for-ai-and-bi-0c2a54042c6c
[2] https://medium.com/@pierre.oberholzer/iso-20022-a-ready-to-use-knowledge-graph-9a7955f8ea7b
[3] https://medium.com/@pierre.oberholzer/iso-20022-road-to-riches-4618e029dbf8
[4] https://medium.com/@pierre.oberholzer/iso-20022-navigating-rich-semantics-7571ea76f8a2